- K-means clustering is simple unsupervised learning algorithm developed by J. MacQueen in 1967 and then J.A Hartigan and M.A Wong in 1975.
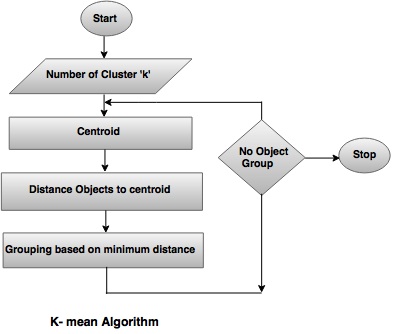
- In this approach, the data objects ('n') are classified into 'k' number of clusters in which each observation belongs to the cluster with nearest mean.
- It defines 'k' sets (the point may be considered as the center of a one or two dimensional figure), one for each cluster k ≤ n. The clusters are placed far away from each other.
- Then , it organizes the data in appropriate data set and associates to the nearest set. If there is no data pending, first step is complicated to perform, in this case an early grouping is done. It is necessary to re-calculate 'k' new set as barycenters of the clusters from previous step.
- After having these 'k' new sets, the same data set points and the nearest new sets are bound together.
- Finally, a loop is generated. As a result of this loop, the 'k' sets change their location step by step until no more changes are made.
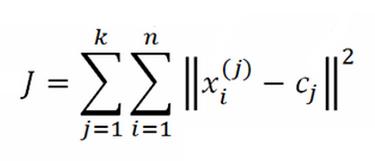
where,
xi(j) = data point
cj = cluster center
n = Number of data points
k = Number of cluster
||xi(j) – cj||2 = distance between a data point xi(j) and cluster centre cj.
Solved examples of K-means:
Method 1:Using K-means clustering, cluster the following data into two clusters and show each step.
{2, 4, 10, 12, 3, 20, 30, 11, 25}
Solution:
Given: {2, 4, 10, 12, 3, 20, 30, 11, 25}
Step 1: Assign alternate value to each cluster randomly.
Step 2: k1= {2, 10, 3, 30, 25}, Mean value= 14
k2= {4, 12, 20, 11, 25}, Mean value = 11.75
Step 3: Again assign the values,
k1 = {20, 30, 25}, Mean value = 25
k2 = {2, 4, 10, 12, 3, 11}, Mean value = 7
Step 4: Again assign the values,
k1 = {20, 30, 25}, Mean value = 25
k2 = {2, 4, 10, 12, 3, 11}, Mean value = 7
Method 2:
Step 1: Randomly assign the means: m1 = 3, m2 = 4
Step 2: Group the numbers close to mean m1 = 3 are grouped into cluster k1 and m2 = 4 are grouped into cluster k2
Step 3: k1 = {2, 3}, k2 = {4, 10, 12, 20, 30, 11, 25}, m1= 2.5, m2 = 16
Step 4: k2 = {2, 3, 4}, k2 = {10, 12, 20, 30, 11, 25}, m1= 3 m2 = 18
Step 5: k1 = {2, 3, 4, 10}, k2= {12, 20, 30, 11, 25}, m1= 4.75, m2 = 19.6
Step 6: k1 = {2, 3, 4, 10, 11, 12}, k2 = {20, 30, 25}, m1 = 7, m2 = 25
Step 7: k1 = {2, 3, 4, 10, 11, 12}, k2 = {20, 30, 25}, m1 = 7, m2 = 25
Step 8: Stop. The clusters in step 6 and 7 are same.
Final answer: k1 = {2, 3, 4, 10, 11, 12} and k2 = {20, 30, 25}
K-Medoids
- Instead of taking the mean value of the object in a cluster as a reference point, medoid can be used. It is most centrally located object. It is also called as Partitioning Around Medoids (PAM).
- In a single partition of data into 'K' clusters, where each cluster consists of point, this is centrally located point of the cluster based on some distance measure. These representative points are called as medoids.