Knowledge Representation
Knowledge representation is the presentation of knowledge to the user for visualization in terms of trees, tables, rules graphs, charts, matrices, etc.For Example: Histograms
Histograms
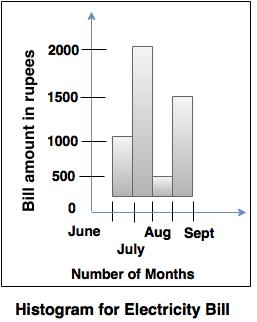
- Histogram provides the representation of a distribution of values of a single attribute.
- It consists of a set of rectangles, that reflects the counts or frequencies of the classes present in the given data. Example: Histogram of an electricity bill generated for 4 months, as shown in diagram given below.
Data Visualization
- It deals with the representation of data in a graphical or pictorial format.
- Patterns in the data are marked easily by using the data visualization technique.
1. Pixel- oriented visualization technique
- In pixel based visualization techniques, there are separate sub-windows for the value of each attribute and it is represented by one colored pixel.
- It maximizes the amount of information represented at one time without any overlap.
- Tuple with 'm' variable has different 'm' colored pixel to represent each variable and each variable has a sub window.
- The color mapping of the pixel is decided on the basis of data characteristics and visualization tasks.
2. Geometric projection visualization technique
Techniques used to find geometric transformation are:i. Scatter-plot matrices
It consists of scatter plots of all possible pairs of variables in a dataset.
ii. Hyper slice
It is an extension to scatter-plot matrices. They represent multi-dimensional
function as a matrix of orthogonal two dimensional slices.
iii. Parallel co-ordinates
- The parallel vertical lines which are separated defines the axes.
- A point in the Cartesian coordinates corresponds to a polyline in parallel coordinates.
3. Icon-based visualization techniques
- Icon-based visualization techniques are also known as iconic display techniques.
- Each multidimensional data item is mapped to an icon.
- This technique allows visualization of large amount of data.
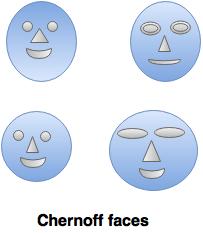
- The most commonly used technique is Chernoff faces.
- This concept was introduced by Herman Chernoff in 1973.
- The faces in Chernoff faces are related to facial expressions or features of human being. So, it becomes easy to identify the difference between the faces.
- It includes the mapping of different data dimensions with different facial features. For example: The face width, the length of the mouth and the length of nose, etc. as shown in the following diagram.
4. Hierarchical visualization techniques
- Hierarchical visualization techniques are used for partitioning of all dimensions in to subset.
- These subsets are visualized in hierarchical manner.
i. Dimensional stacking
- In dimension stacking, n-dimensional attribute space is partitioned in 2-dimensional subspaces.
- Attribute values are partitioned into various classes.
- Each element is two dimensional space in the form of xy plot.
- Helps to mark the important attributes and are used on the outer level.
- Mosaic plot gives the graphical representation of successive decompositions.
- Rectangles are used to represent the count of categorical data and at every stage, rectangles are split parallel.
- Worlds within worlds are useful to generate an interactive hierarchy of display.
- Innermost word must have a function and two most important parameters.
- Remaining parameters are fixed with the constant value.
- Through this, N-vision of data are possible like data glove and stereo displays, including rotation, scaling (inner) and translation (inner/outer).
- Using queries, static interaction is possible.
- Tree maps visualization techniques are well suited for displaying large amount of hierarchical structured data.
- The visualization space is divided into the multiple rectangles that are ordered, according to a quantitative variable.
- The levels in the hierarchy are seen as rectangles containing the other rectangle.
- Each set of rectangles on the same level in the hierarchy represents a category, a column or an expression in a data set.
- This technique is used to visualize non-numeric data.
For example: text, pictures, blog entries and product reviews. - A tag cloud is a visualization method which helps to understand the information of user generated tags.
- It is also possible to arrange the tags alphabetically or according to the user preferences with different font sizes and colors.
Pre-processing of the data
- The process of transformation of the data into information by using different methods like classifying, sorting, merging, recording retrieving, transmitting and recording is called as data processing. The data processing can be performed manually or automatically.
- The data pre-processing is required, if the data is incomplete (data is incomplete when attributes or attribute values are missing), noisy (data contains errors), unreliable or irrelevant.
- The data pre-processing involves several operations such as cleaning, integration, reduction, transformation and discretization.
1. Data cleaning
- Data cleaning is also known as scrubbing or cleansing.
- The data cleansing process detects and removes the errors and inconsistencies to improve the quality of the data.
i. Parsing:
Parsing is a process in which individual data elements are identified from the source system and then these data elements are isolated in the target file.
ii. Correcting:
This is the next phase after parsing, in which individual data elements are corrected by using different algorithms and comparing secondary data sources.
iii. Standardizing
In this step, the data is transformed into a consistent format by using various business rules.
iv. Matching
Matching process eliminates the duplicate data by searching and matching the record with first three steps.
v. Consolidating
The different matched records are identified and analyzed to merge records into the single file or representation.
2. Data integration
It is a process of collecting and combining the data from the several available data sources to provide the standardized view of the data to database users.3. Data Transformation
- Data in operational databases keeps changing according to the requirements, so the data warehouse can face the problem of inconsistency, while integrating the data from multiple data sources.
- The transform stage of an ETL (Extract, Transform, Load) process includes an application with series of rules or functions to extract the data. It also includes the validation of the records and their rejection, if the records are not acceptable.
- The amount of manipulation of data needed for the transformation process depends on the type of data. The good data sources require less transformation while other may need more transformation to meet the technical requirements of the data warehouses.
- The most commonly used techniques for transformations are conversion, standardizing, filtering,sorting, translation, etc.
4. Data reduction
- The amount of the data extracted in the data-ware house may be very large. Mining and analyzing such data may be time consuming.
- Data reduction techniques are applied to obtain a reduced representation of the data to a smaller volume and to maintain integrity.
- Data reduction can be performed by using techniques like data cube aggregation, dimension reduction, data comparison, etc.
5. Data Discretization
- Data discretization method is used to reduce the size of the data.
- In this method, a continuous attribute is divided into intervals.
- Dividing the range of attributes into the interval can reduce the number of values for the given continuous attributes.
- Discretization process can be applied recursively to an attribute.